Phase Two Consultation
In Phase Two, Navitus Bay presented plans in eight locations across the region. Over 2,000 people attended the Phase Two events which were held in February and March 2012. Navitus Bay received 801 partially completed or fully completed feedback forms during the consultation period.
Consultees were asked people to view different wind park development options to gauge which turbine size layout would have the biggest visual impact. Of the 272 responses:
- 118 stated that the 3.6MW turbines would have the greatest visual impact.
- 84 stated that the larger 9MW turbines would have the greatest impact.
- 49 stated that a range (ie 3.6 and 9MW turbines) would have the greatest impact
- 21 respondents stated that they had not seen the visuals.
The proposed development was divided into four sections and consultees were asked to indicate relevant concerns with constructing wind turbines in each of the four areas. 418 people
responded to this question and 51 did not provide an answer. The results are shown below.
 Click here for the summary of the responses.
vessels, eg. ferry in the area
boats, eg. yachts in the area.
munitions and offshore
archaelogy
In response to the principal concerns relating to (1) a higher number of small turbines; and (2) development in the northern section of the proposed development area, we made a number of changes to the offshore development area. We also took into consideration feedback we received from key regulators and other local consultees. A summary of the offshore project revisions is shown in figure 8 and figure 9 shows the original and revised offshore development area.
Click here to view figure 8.
13.5km (or 8.4 miles) from Hengistbury Head (Christchurch)
16.4km (or 10.2 miles) from Hengistbury Head (Christchurch)
Protect navigational safety for vessels entering the solent
Lower the number of turbines needed
Click here to view figure 9.
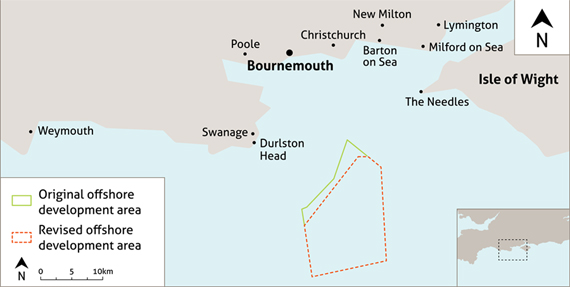
The original and revised offshore development area


